Moringa Cultivation and Uses

General Information of Moringa tree

Moringa is widely cultivated for its young seed pods and leaves, used as vegetables and for traditional herbal medicine. The plant has numerous common names across regions where it is cultivated, with drumstick tree, horseradish tree, or simply Moringa used in English.

Moringa derives from the Tamil word, murungai, meaning “twisted pod”, which alludes to the young fruit. The species name oleifera is derived from the Latin words oleum “oil” and ferre “to bear”.

Moringa is a fast-growing, drought-resistant tree of the family Moringaceae, native to the Indian subcontinent. The plant height varies from about 10 to 12 meters. The trunk diameter could be around 45 cm. It’s bark has a whitish-grey color and is surrounded by thick cork. Young shoots have purplish or greenish-white, hairy bark. The tree has an open crown of drooping, fragile branches, and the leaves build up a feathery foliage of tripinnate leaves.

The flowers are fragrant and hermaphroditic, surrounded by five unequal, thinly veined, yellowish-white petals. The flowers are about 1.0–1.5 cm (1/2 in) long and 2.0 cm (3/4 in) broad. They grow on slender, hairy stalks in spreading or drooping flower clusters, which are 10–25 cm long.

Soil requirement

The Moringa tree is grown mainly in semiarid, tropical, and subtropical areas. It requires sandy or loamy soil with a slightly acidic to slightly alkaline pH (pH 6.3 to 7.0). In waterlogged soil, the roots have a tendency to rot. Moringa is a sun- and heat-loving plant, and does not tolerate freezing or frost. Rainfall of around 250 – 3000 mm is suitable.

Cultivation practice

Soil preparations

Plowing is required only for high planting densities. It is preferred to plant by digging pits and refilling them with soil.  Pits ensure good root system penetration without causing too much land erosion. Optimal pits are 30–50 centimeters (12–20 in) deep and 20–40 centimeters (7.9–15.7 in) wide.

Propagation

The direct seeding method is generally done since Moringa seeds are expected to germinate within 5–12 days after seeding at a depth of around 2 cm in the soil. Another way is to first seed it in plastic bags containing sandy or loamy soil and then transplant it into pits once it grows to about 30 cm. Cultivation from cuttings of 1 m length and 4–5 cm in diameter is also done. Such plants may not have a good deep root system and are more sensitive to drought and winds.

Because Moringa is cultivated and used in different ways, breeding aims for an annual or a perennial plant are obviously different. If cultivated for leaves production, then regular branch cutting is done.

Yield and harvest

Moringa can be cultivated for its leaves, pods, and/or its kernels for oil extraction and water purification. The yields vary, depending on season, variety, fertilization, and irrigation regimen. Moringa yields best under warm, dry conditions with some supplemental fertilizer and irrigation. Harvest is done manually with knives, sickles, and stabs with hooks attached.  Pruning of trees is recommended to promote branching, increase production, and facilitate harvesting.

Fruits

The first harvest can take place 6–8 months after planting. Often, the fruits are not produced in the first year, and the yield is generally low during the first few years. By year two, it produces around 300 pods, by year three around 400–500. A good tree can yield 1000 or more pods. In India, a hectare can produce 31 tons of pods per year. Under North Indian conditions, the fruits ripen during the summer. Sometimes, particularly in South India, flowers and fruit appear twice a year, so two harvests occur, in July to September and March to April.

Leaves

Average yields of 6 tons/ha/year can be achieved. The harvest differs strongly between the rainy and dry seasons. The difference could be as large as 1100 kg/ha per harvest and 700 kg/ha per harvest, respectively. The leaves and stems can be harvested from the young plants 60 days after seeding and then another seven times in the year. At every harvest, the plants are cut back to within 60 cm of the ground. In some production systems, the leaves are harvested every 2 weeks.

Oil

One estimate for a yield of oil from kernels is 250 L/ha. The oil can be used as a food supplement, as a base for cosmetics, and for hair and the skin. Seeds of Moringa can also be used in the production of bio fuel.

Pests and diseases

The Moringa tree is not affected by any serious diseases in its native or introduced ranges.   Insect pests that affect this plant are caterpillars, aphids, stem borers, fruit flies, and powdery mildew. Mites also affect this plant. For more on pests, readers may like to go through our blogs on Diseases and Pests and on the Concept of Integrated Pest Management.

Nutrients

Various parts of Moringa are edible:

  • Immature seed pods, called “drumsticks”
  • Leaves
  • Mature seeds
  • Oil pressed from seeds
  • Flowers
  • Roots

The table below shows the nutritional content of 100 g per plant material.

NutrientsFresh leavesDry leavesLeaf powderSeedPods
      
Calories (cal)9232920526
Protein (g)6.729.427.135.97 ± 0.192.5
Fat (g)1.75.22.338.67 ± 0.030.1
Carbohydrate (g)12.541.238.28.67 ± 0.123.7
Fiber (g)0.912.519.22.87 ± 0.034.8
Vitamin B1 (mg)0.062.022.640.050.05
Vitamin B2 (mg)0.0521.320.50.060.07
Vitamin B3 (mg)0.87.68.20.20.2
Vitamin C (mg)22015.817.34.5 ± 0.17120
Vitamin E (mg)44810.8113751.67 ± 4.41
Calcium (mg)440218520034530
Magnesium (mg)42448368635 ± 8.6624
Phosphorus (mg)7025220475110
Potassium (mg)25912361324259
Copper (mg)0.070.490.575.20 ± 0.153.1
Iron (mg)0.8525.628.25.3
Sulfur (mg)8700.05137

Use of different parts of the Moringa plant

Leaves

Moringa tree leaves are cooked and used in ways similar to spinach and are commonly dried and crushed into a powder for soups and sauces. The leaves are a significant source of B vitamins, vitamin C, vitamin A as beta-carotene, vitamin K, manganese, and protein.

Drumsticks
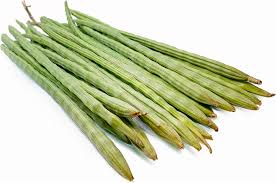
moringa drum sticks
drum sticks of Moringa

Drumstick vegetable pods at a market

The immature seed pods are called “drumsticks”. They are prepared by parboiling and cooked in a curry until soft. The seed pods/fruits, even when cooked by boiling, remain high in vitamin C (which may be degraded variably by cooking), and are also a good source of dietary fiber, potassium, magnesium, and manganese.

Seeds

The seeds are removed from mature pods and eaten like peas or roasted like nuts.

Seed oil

Mature seeds yield 38–40% edible oil called ben oil from its high concentration of behenic acid. Commercially, behenic acid is often used to give hair conditioners and moisturizers their smoothing properties.  If used as a food it can raise cholesterol levels.

Roots

The roots are shredded and used as a condiment with sharp flavor qualities deriving from the significant content of polyphenols. According to some studies, polyphenols interfere with nutrient intake. 

Culinary uses

People worldwide use Moringa in their kitchens in different ways. The edible parts are its leaves, seedpods (drum sticks), flowers, seeds, and roots.

Traditional medicine and research

Traditional medicine practitioners use the bark, sap, roots, leaves, seeds, and flowers. There is no high-quality evidence to indicate that it has any effect on health or diseases..

Potential adverse effects

There is not enough lab study data to indicate that certain compounds in the bark and roots or their extracts may cause adverse effects when consumed in excess.

Other uses

In developing countries, Moringa has the potential to improve nutrition, boost food security, foster rural development, and support sustainable land care. It is used as forage for livestock, a micro nutrient liquid, a natural anthelmintic, and a possible adjuvant.

Moringa leaf powder can be used for handwashing when wetted in advance to enable anti-septic and detergent properties from phytochemicals in the leaves.

Seeds of this tropical tree contain water-soluble, positively charged proteins that act as an effective coagulant for water and wastewater treatment.

References:
  1. https://en.wikipedia.org/wiki/Moringa_oleifera
  2. https://www.sciencedirect.com/science/article/pii/S2213453016300362#bib041

Posted in vegetables Tagged with: , ,

Steps to Drip irrigation system design

Drip Irrigation System design is a very interesting and oft searched subject for the farmers.

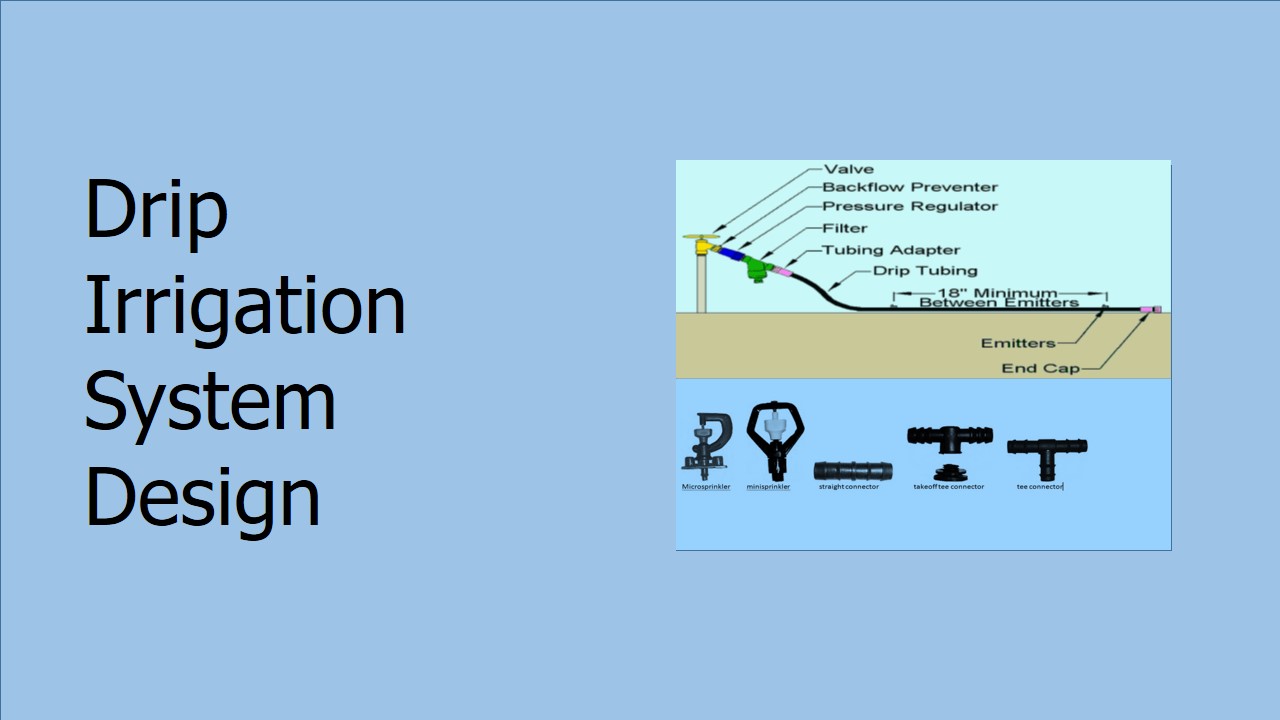
drip irrigation layout and dripline components

Why Have the Drip Irrigation System

Drip irrigation systems avoid wastage of water and conserve precious gifts. This type of irrigation system is obviously not indicated for rain-fed agricultural activities. However considering the severe depletion of water resources the world over, drip irrigation is gaining ground. The motto of drip irrigation is one drop more crop.

It is easy to install, easy to design, can be very inexpensive, and can reduce disease problems associated with high levels of moisture on some plants.

Drip irrigation system allows what is termed fertigation i.e. fertilization plus irrigation.  Fertilizer is sent mixed with irrigation water to plants.  Such fertigation not only economizes but also adds effectiveness and efficiency to the fertilization process. The first is that the water soaks into the soil before it can evaporate or runoff. The second is that the water is only applied where it is needed, (at the plant’s roots) rather than sprayed everywhere.

For more on why have the drip irrigation system, our blog DRIP IRRIGATION provides greater insight.

What Goes Into a Drip Irrigation System

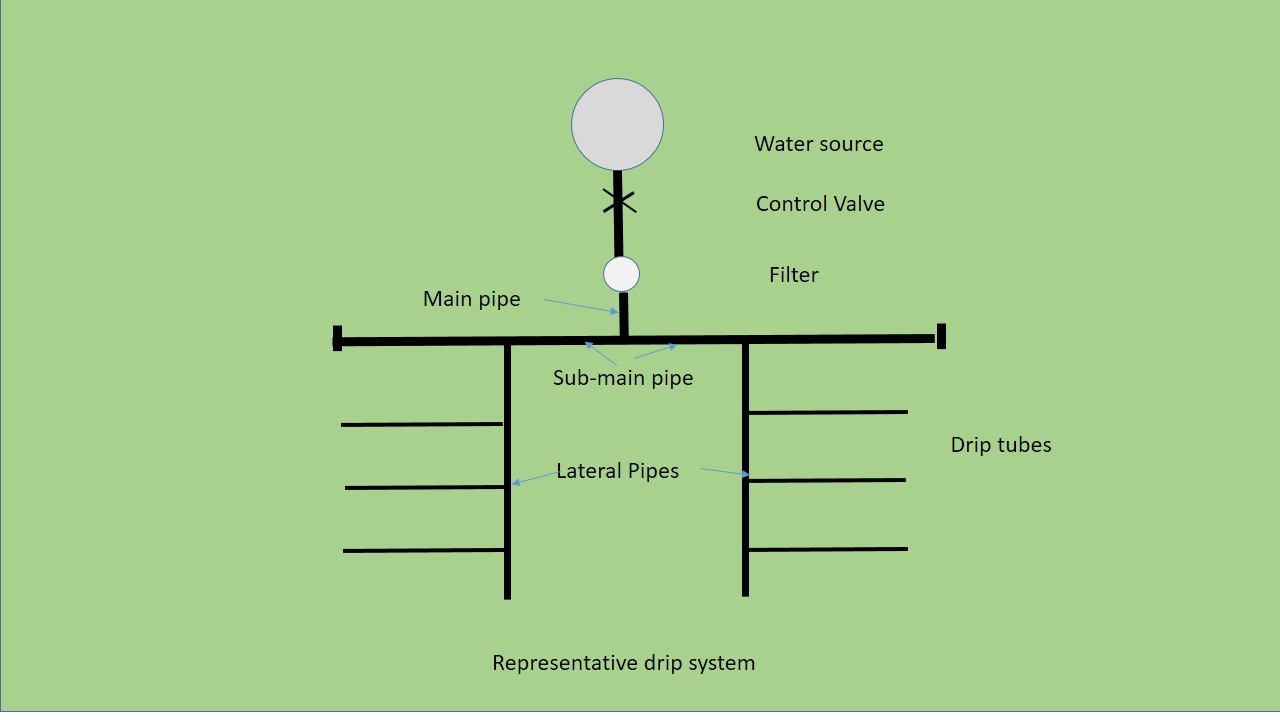
To get to know what are all bundled in our drip irrigation system, let us refer to the following representative figure:

components of a drip irrigation system

So we require a water source, a control valve (actually we may require several control valves for each of our sub-mains), main pipe, sub-main pipes, lateral pipes, and then the drip tubing (there are different types – use as required).

Information Required Beforehand

The first step a farmer needs is to collect the following information:

  • Layout of the area.
  • Details of the water source and soil type.
  • Type of crop proposed, crop period, season, plant canopy area, etc.).
  • Climatic data (rainfall, temperature, evapotranspiration, etc.).
  • Water requirement

Brief on Water Requirement

The water requirement of plants depends on many factors such as temperature, humidity, soil type, wind velocity, growth stage, shade/sun, etc. Plants absorb soil moisture and transpire it to the atmosphere during the process of photosynthesis. Some amount of water is retained in the plant tissue and the rest of the soil moisture gets evaporated into the atmosphere.

Drip irrigation involves the frequent application of water, even on a daily basis. Therefore, the water requirement of the plant per day is equivalent to the rate of potential evapotranspiration per day.

Evapotranspiration: the quantity of water transpired by the plants plus the quantity of water retained in the plant tissue and water evaporated from the soil surface. The reference values for evapotranspiration are normally available for a particular area at the nearest meteorological observatory.

Water requirement (WR) can be expressed by the following expression:

WR (Liters per day) = ET x Kc x Cp x Area, where

ET is evapotranspiration (mm per day),
Cp is canopy factor,
Area in sq. meter

If specific crop factor Kc values are not available, then it can be assumed as one.

The canopy factor is the percentage of area covered by plant canopy (foliage).

The area for orchards is the multiplication of the distance from the plant to plant (m) and distance from row to row (m). For row plantations, the unit area can be taken to calculate water requirements.

Example: Calculate peak water requirement – plants spacing of 2 m by 2m. Assume peak ET for the area as 6 mm per day, crop factor as 0.9, and canopy factor 0.7.

Peak water requirement per day = 6 x 0.9 x 0.7 x 2 x 2 = 15.12 liters per day per plant

Actual daily water requirements will depend on the daily rate of evapotranspiration which is less during winter and higher in summer.

Irrigation Time 

Irrigation time is defined as the total water flow period through the emitter required such that by the plant receives the daily water required.  We can write this as the expression:

Irrigation time (hours/day) = Daily Water requirement (liters per day) / application rate (liters/hour)

The application rate would be set by the emitters selected e.g. 2, 4, 8 liters per hour.

Example: Daily water requirement = 10 liters per day; drip system discharge rate = 4 liters per day.

Irrigation time (hours/day) = 10/4 = 2.5 hours/day

Step-wise Plan For Irrigation System

Armed and aided by the above information, we now plan a customized drip irrigation system:

  • Detail of layout of the system in the field.
  • Emitter selection and placement.
  • Size and length of mainline, sub-main, and lateral pipes.
  • Pumping and filtration requirement.
  • Operating schedule for irrigation.
  • Material and cost estimate.

Layout Details of Drip System in the Field

The following survey inputs are required to prepare an accurate layout of any area (size, shape, and slope) for the design of a micro-irrigation system:

  1. Position of water source (tank, well, reservoir, pond, river, stream, existing pump, pipeline, etc.).
  2. Size, volume, flow rate, and height above ground level or depth from the ground surface or water source.
  3. Pump details for the existing pump e.g. suction, delivery, actual discharge, and head, operating time, pump HP, expected discharge, and head.
  4. Quality of water including any impurities in water (algae, sand /silt, etc.).
  5. Water analysis report.
  6. The details of existing or future crops.
  7. Crop spacing, number of plants and number of rows, crop duration, expected canopy, rainfall, evapotranspiration, etc.
  8. Soil analysis report.
  9. Location of farmhouse large trees, rocks, etc.

Emitter Selection

Emitters regulate and assure a uniform rate of flow of water.   These are (drippers) are sometimes inbuilt in the tubing and also attached to the tubing by picking a hole in it and inserting an emitter.  Emitters are classified by type of making. 

Long Path Emitters have a small diameter and rather a lengthy path. This reduces the water pressure and gives a uniform flow. Short-Path Emitters have shorter water paths. These work well on low-pressure drip systems but are prone to clogging. The Tortuous Path or Turbulent Path Emitter is somewhat like the Long Path one but has many sharp turns and obstacles in the path. This reduces the need for long path length. The diameter is larger. The diaphragm emitter uses a flexible diaphragm to reduce the flow and pressure. This type is more accurate in controlling the flow and pressure. Drip-line type is a tube with factory preinstalled emitters. The emitters are molded inside the tubing. The emitters are uniformly distributed throughout the length of the tubing. Drip-line is laid on the surface only.

Emitters come in a variety of different flow rates. The normal values are 2.0, 4.0, or 8.0 liters/hour (liters per hour). For sand, we should use a 4.0. Normally, it is preferred to use 2.0 liters per hour emitters for better absorption of water as it comes out of the emitter.

Distribution Components

  1. Valves: A) Isolation valves – required to isolate water source from the drip system for any maintenance work. Such valves are manually operated. B) Control Valve – can be manual or automatic. The purpose is to turn on and off the flow of water into a particular drip circuit.
  2. Back flow Preventer: it is required in order that no dirt or any other damaging material is sucked back into the water source.
  3. Pressure regulator: this is a valve with a pressure sensor that controls the opening of the valve. A control valve can also be used by manual partial opening.
  4. Filter: it is for cleaning the water so that emitters do not get clogged.
  5. Emitters: already discussed.
  6. Main: it is the pipe that connects the water source to the main control valve. In case PVC is used for the main pipe take care to bury it in the earth as sunlight damages the PVC pipe.
  7. Sub-Main and Lateral: this terminology in some places is used interchangeably. The purpose is to connect the control valve to the drip emitters.
  8. Drip tube fittings: these are different types of fittings to connect drip lines in the way required.
  9. Air Vent: these are required to allow air to escape when the system is turned on. It also prevents air from being sucked into the emitters when the system is turned off.
  10. Flush valves or end cap: The end cap is put at the end of the drip line so that water does not run out. End caps make the water pressure uniform. Flush valves are put at the end of the sub-main and lateral pipes to regularly flush out any algae or chemicals remaining so as not to clog the drippers.

Size and length of mainline, sub-main, and lateral pipes

We have selected suitable emitter type and flow rates in required liters per minute based on:

  • type of crop,
  • water requirement,
  • operating time,
  • soil type, and
  • water quality.

Flow carried by each lateral line

Q1 = Discharge of one emitter x No. of emitters per lateral
Flow carried by each sub-main Q = Q1 x number of lateral lines per sub main
Flow carried by main Q = Q1 x number of sub-main

The diameter of the main, sub-main, and laterals are chosen based on the hydraulics of pipe flow.

The length and size of lateral lines are determined based on the lateral line flow rate for the field size. Similarly, the size and length of the sub-main pipe are determined. (Each sub-main is an individual unit with its own control valve.) The whole area is then divided into different sub-main units. The number of sub-main units that can operate at any one time is based on the existing pumping/water source capacity. Sections should be designed such that the discharge is similar for all the sections.

The mainline is then planned to connect all the sub-mains by taking the shortest possible route. The length of the main pipe can be determined based on the flow rate so that frictional head loss is within specified limits and the total pressure head required for the system is within pump/water source capacity.

Pumping and filtration requirement

If there is no pump, then the pump requirement is worked out from the total discharge and pressure head required for the system. How to determine pump capacity has separately been described in our blog on same.

Depending on the flow rate and water quality, a suitable filtration device is selected.

The total quantity of all the components is calculated from the layout to prepare a cost estimate.

Chemical fertigation

Drip irrigation systems only for irrigation purposes only would normally not be used.  This is because drip technology gives us a very efficient and cost-effective alternative to fertilize our fields, plants, and crops. We have covered this topic in detail in our separate blog on our website.

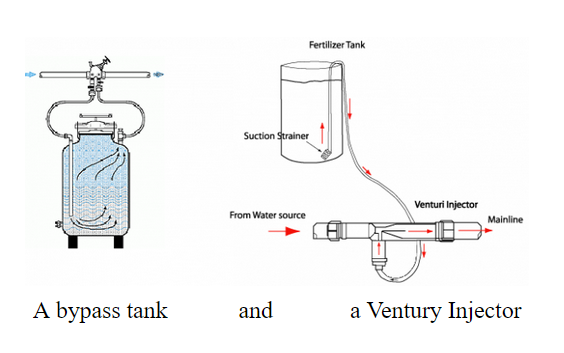
The figure below shows a typical method of applying fertilizers (liquid fertilizers) through the drip system.   This block is placed after the main control valve and before the main filter.  The mainline flow is forced to flow through the smaller pipes to which a venture is attached.  Due to pressure differential venture sucks fertilizer solution and adds to water and whole then flows out into the drip lines.

bypass tank and venturi injector fertigation systems
typical fertigation systems

Survey Plan

From the above information, a plan of the area surveyed can be prepared on a 1:1000 scale. For smaller areas, an appropriate scale can be used depending on the size of the area. The drip system layout can be prepared on this plan and then it can be used for installation.

Further reads:

  1. http://ecoursesonline.iasri.res.in/mod/page/view.php?id=2042
  2. https://myknowledgebase.in/fertigation-what-why-and-how/
  3. https://myknowledgebase.in/how-to-choose-a-pump-motor-for-irrigation/

Posted in Drip Irrigation Tagged with: ,

How to Maintain Agri-Equipment Good

agri-equipment and stores require maintenance
agri-equipment and store room require maintenance
some agri-equipment

Introduction

Agri-equipment or Farming equipment can be 1. mobile (tractors, harvesters, and plows) or 2. fixed in place (conveyor belts, mixers, pasteurizers). Farmers need to maintain agri-equipment on regular basis to make sure it is available on time and operates reliably. Readers may also like to go through my earlier blog.

All the agri-equipment mostly operate in unfriendly environment. Rough terrain, heat and rain and cold, sometimes working at max capacity for long hours – all these take toll on the machines and equipment. Consistent maintenance keeps them going for their full life cycle and even beyond.

This blog is a general guideline on how and what to maintain agri-equipment. It would certainly help a farmer for that objective. Let it be said that equipment electronics and wireless is not included in this blog.

Agri-Equipment farmer require to maintain

  • Tractors
  • Seed drills
  • Planters
  • Balers
  • Plows
  • Manure spreaders
  • Cultivators
  • Harvesters
  • Irrigation systems
  • Storehouses
  • Silos
  • Sprayers
  • Conveyor systems
  • Mixers
  • Fume washers
  • Dispensers
  • Refrigeration/temperature control systems

The list could be little different, that would depend on farm size and farmer’s choice.

Why maintain agri-equipment

That is question someone may well ask. Incidents like when bolts of the equipment came out, or the bearings ran dry, or someone forgot to fill up the lubes! Exactly. The role of maintain agri-equipment program?  Get your agri-equipment ready for work at time of your requirement. Farmers must kept safe, clean, and structurally sound ancillary facilities meant to process and store foodstuffs in order to keep farm’s product safe for consumption.

Who will maintain agri-equipment?

Most times it is the farmers themselves. At times trained labor would carry out repair and maintenance.  It needs to be stressed that farmers must also be trained in working and maintenance. This prevents accidents and injuries when proper steps are not followed.

What can be done in routine maintenance by farmer and/or his assistant(s)?

Summarized Guide to Maintain Agri-equipment:

Repair and maintenance of tillage and soil farming agri-equipment

  1. Adjustments of plough, horizontal, vertical and draft.
  2. Check for loose nuts and bolts and replace as required.
  3. Clean MB plough. Apply used oil for rust prevention if left unused for long time.
  4. Check the bearings. Tighten castle nut.
  5. Clean and change grease nipples as necessary.
  6. Lubricate bearings.
  7. Clean and wash the equipment after use.

Maintenance of seed drills and planters

  1. Empty seed and fertilizer cups, clean same.
  2. Wash the rollers and boxes with diesel. This is to avoid rusting. Lubricate rolling parts.
  3. Ensure alignments.

Maintenance of plant protection equipment like sprayers.

  1. Clean tank, nozzles and filters.
  2. Maintenance of pump assembly, pressure regulator.
  3. Follow safety and precaution protocols while handling chemicals as it will prevent mishaps.

Repair and maintenance of Harvesting, Threshing and Post-Harvest machinery/agri-equipment.

  1. Power Reapers: clean guards, check conveyor belt for damages and replace if required, check tension of belt, lubricate all moving parts, repaint surfaces as required.
  2. Power threshers: clear thresher, check for any damage on feeder unit, clean all parts, tighten all bolts and nuts, grease and lubricate.
  3. Post-Harvest machines: inspect and clean all parts, lubricate.
  4. Carry out adjustments for Reapers, Threshers and Post-Harvest machinery:  adjust tension of reel belt, inspect the binding and tying, inspect the bundle size and adjust as required to feeding roller gap, cutting gap, cleaner feed rate, sieve slop, air flow rate.

Upkeep of any equipment not to be used for some time

  • Disconnect batteries or charge them throughout the season.
  • Cleaning heavy equipment.
  • Draining and cleaning Pesticide Application Equipment.
  • Checking antifreeze and hydraulic fluids, and changing them out if necessary.
  • Draining the diesel exhaust fluid tank (if needed).
  • Oil equipment for storage.
  • Making any outstanding repairs.
  • Performing other routine preventive maintenance tasks.

Other Routine Upkeep

Cleaning is an important task to be carried out on a regular basis. Simple cleanup tasks can be done daily, while more thorough scouring is often handled weekly or monthly.

Common Preventive Maintenance Tasks for Farm Buildings

Farmers use number of structures for storing or processing foods. Walls and surfaces need to be nontoxic and nonabsorbent to make sure food products are safe. Patch up any cracks or breakages to facilitate regular sanitation.

Make sure that Heating, Ventilation, and Air Conditioning (HVAC) systems are set for right temperature and that any dust, vapors, or fumes are properly siphoned out of the building.

Provide inclination in floors as it will ensure drainage in areas where fluids (milk or water) are handled. Repair damaged floors early

Keep gutters and downspouts clear of debris as it will ensure no obstruction to draining of water. Goes a long way in preventing possible flooding and structural damage.

Ensure all lights are in working order. Shatterproof shielding is recommended for all bulbs in storing areas. This keeps broken debris from contaminating foodstuffs.

Property Upkeep

  • Mowing, pulling weeds, and general landscaping
  • Remove snow in winter months (as applicable)
  • General cleaning and janitorial work
  • Trash removal

Important use Correct Tools

Using the wrong tool for the job stresses the mechanical parts and result in a severe injury by causing an accident. Make sure the required tools are available in advance for each maintenance task.

Seek Training

It is not a question of any ego. Learning on hand by one self is what is usual. Learning from experts on hand is most desirable.

It is really not possible to make a detailed maintenance manual for all the varied agri-equipment in one short blog. Farmers should seek Maintenance manuals provided by the O.E.Ms as same are of great value. Farmers do need to maintain agri-equipment consistently. This will pay dividend at all times.

Posted in farm guide, implements&machinery Tagged with: , , ,

How to Select Your Tractor

General

A tractor is an engineering vehicle specifically designed to deliver at a high tractive effort at slow speeds, for the purposes of hauling a trailer or machinery used in agriculture or construction.

The farm tractor is used for pulling or pushing agricultural machinery or trailers, for plowing, tilling, disking, harrowing, planting, and similar tasks. The word tractor was taken from Latin, being the agent noun of trahere “to pull”. Another definition is combining two words – traction and motor. The first recorded use of the word meaning “an engine or vehicle for pulling wagons or ploughs” occurred in 1896, from the earlier term “traction engine”.

Tractor engine is used as a prime mover for active tools and stationary farm operations through power take-off shaft or belt pulley.

Tractors can be generally classified by number of axles or wheels, with main categories of two-wheel tractors (single-axle tractors) and four-wheel tractors (two-axle tractors).

Tractor Classification

Tractors classified on type of construction:

  • Riding type tractors – Tractors in which a driver can sit and drive e.g., General purpose four wheel tractors.
  • (b) Walking type tractors – Tractors with which the operator walks along e.g., garden tractors, power tillers.

Tractors based on type of drive:

  • Track type tractors – In this type of tractors, instead of wheels; one track is fitted on either side. This track gets drive from the sprocket run by rear axle shaft. To steer the tractor, there is not steering gear fitted. The tractor is steered by applying brakes to one side of the track with the other track moving. These are used for bulldozing or land clearing work.
  • Wheel type of tractors – These are most commonly used agricultural tractors. They can run fast and wheel tyres absorb a certain amount of field shocks also.

Wheel type tractors

  • Two-wheel tractors – These tractors are used for small farms, hilly area and gardening purposes and are called power tillers. They are also termed as Power Tillers.
  • Three-wheel tractors – These tractors were very popular 15 years back but now its place has been taken by four wheel tractors. These tractors had single or dual wheel fitted at the front end in the center and were considered good for negotiable shorter turns.
  • Four-wheel tractors – These are most commonly used tractors in the country. These are also known as all-purpose tractors.

Tractors based on power of tractors

  • Small tractors – 15 to 25 hp.
  • Medium tractors – 25 to 45 hp.
  • Large tractors – more than 45 hp.

Tractors based on specific purpose of use

  • Utility tractors – Built for one specific purpose.
  • All-purpose tractor – Built to meet practically all demands for agricultural purposes such as ploughing, harrowing, leveling, pulling, seed drill, operating threshers, and pumps through its P.T.O.
  • Orchard type tractors – Built especially to be used in orchards. Are much higher in height so that operations on the trees could be performed. No part of tractor protrudes and tractor can safely go in between trees.
  • Garden tractors – Built smaller than normal for use in kitchen or vegetable gardens.
  • Rotary Tillers – Built for very small holdings or on hills where fields are very small and are at different levels where ordinary tractors cannot work efficiently. Tined blades are fitted to the tillers to prepare the seedbeds quite effectively by pulverizing the soil. These are also used in rice fields for puddling and other operations.
  • Earth Moving tractors – Built strong and heavy in weight both as tract and tyre type. These are used for earth moving work on dams, quarries and other constructional works.

How To Select Your Tractor

Let us turn to selection of a tractor by a farmer and what important requirements are needed to be considered. The tractor should be selected based on the following factors:

Utility

  • Land holding: Under a single cropping pattern, it is normally recommended to consider 1 hp for every 2 hectares of land. In other words, one tractor 20-25 hp is suitable for 40 hectares farm.
  • Cropping pattern: Generally 1.5 hectare/hp been recommended where adequate irrigation facilities are available and more than one crop is taken. So a 30-35 hp tractor is suitable for 40 hectares farm.
  • Soil conditions: A tractor with less wheel base, higher ground clearance and low overall weight may work successfully in lighter soil but it will not be able to give sufficient depth in black cotton soil.
  • Climatic conditions: For very hot zone and desert area, air cooled engines are preferred over water cooled engines. Similarly for higher altitude, air cooled engines are preferred because water is liable to be frozen at higher altitude.
  • Weight of the tractor is considered depending on primary used for. Remember extra weight is good for front end loading, but not good for field work.

Hydraulics

Work of a tractor involves a lot of turning and lifting. The hydraulic system is what makes this possible. Hydraulic fluid transmits energy through the hydraulic system and makes it possible for a tractor to move and work. Same fluid is also responsible for lubrication and control heat transfer. Therefore, before you take a tractor home, ensure that the hydraulic system is functioning optimally.

Comfort and Safety

Look for the comfort and safety of the tractor while buying. Few common things on which you can focus are:

  • Sufficient space between pedals and fenders
  • Proper design of the operator’s platform
  • Seat adjustability and steering wheel
  • Accessibility of controls from a normal range of reach
  • Fine condition of handholds
  • Visibility of panel lights

Transmission

  • Hydrostatic transmission
  • Mechanical transmission

A mechanical transmission is more power-efficient than hydro static transmission. However, the hydro static transmission provides the freedom to select any ground (or engine) speed between zero and the maximum, and thus, it is more efficient in terms of operation.

Repairing Facilities

Check and ensure that the tractor to be purchased has a dealer at nearby place with all the technical skills for repair and maintenance of machine.

Running cost

Tractors with less specific fuel consumption should be preferred over others so that running cost may be less.

Initial Cost And Resale Value

Farmer may not count on adding capabilities later on to a tractor. As farmers requirement increase, it is easy to exchange old tractor with new one. Also one could have more than one tractor for varied uses.

Summary: Check your requirement, check horsepower required, check your budget, what innovative features are available, the resale value, the degree of comfort and safety of operation, and nearness of repair facility.

For Further Reading:

http://ecoursesonline.iasri.res.in/

Posted in farm guide, implements&machinery

Minimum Support Price (MSP) for agri produce is the new war cry.

Indian Government burns its fingers – withdraws Farm Laws.

We, like so many of us concerned with farmers, attempt in this blog to look into their demand for compulsory Minimum Support Price of agri produce. The demand which has forced them to demonstrate all-round the Indian capital for one year or so. Also in other Capitals worldwide too. Braving all sorts of weather and other logistical problems. People have died.

The crippling blockage by Indian farmers has had a disastrous effect on Indian economy already battling with COVID restrictions.

In the Constitution, ‘Agriculture’ has been placed as Entry 14 in the State List along with several ancillary matters, while some agriculture-related items have been included in the Union List and the Concurrent List. Many States have complained that notwithstanding Entry 14 of State List, the Union Government has made undue in roads in the sphere of agriculture, which according to them should remain an area of exclusive State jurisdiction.

Left with few options, Government of India has declared that the three farm laws which riled the farmers would be formally withdrawn in the winter session of the parliament later this month.

The farmers have stated their intention to continue their agitation till laws to protect compulsory Minimum Support Price MSP are also formalized.  The new goal post for government is formulation of compulsory MSP laws.

MSP (Minimum support Price)

MSP exists even today as exemplified by 23 MSPs announced by the Indian government for

  • 7 cereals (paddy, wheat, maize, sorghum, pearl millet, barley and ragi),
  • 5 pulses (gram, tur, moong, urad, lentil),
  • 7 oilseeds (groundnut, rapeseed-mustard, soyabean, sesamum, sunflower, safflower, nigerseed)
  • 4 commercial crops (copra, sugarcane, cotton and raw jute).

How MSP works

In practice the produce comes into the market almost all at one time.  This causes a glut in the mandis and makes for a buyer’s market.  The government procurement agencies have only so much capacity to procure.  This makes farmers vulnerable to distress selling and MSP is no longer operative at least for this distress selling.

Farmers demand, rightly, that nobody would buy or procure the produce below the MSP.

Here are the contradictions.  India has a free economy in all goods and trade. Competition is encouraged to keep prices in control. People are afforded all types of varieties in any one good and choose which suits them best. A maximum retail price (MRP) is put on all goods to ensure no person is cheated by price fixing of a product.

Problems in fixing Minimum Support Price

Fixing law that all agri produce of farmers had to procured/bought at or above minimum support price (MSP) is fraught with several severe problems.

  • Excess production in wheat and rice results every year in large scale destruction and wastage in godowns, railways yards and other places of storage. Ensuring MSP purchase of such produce will result in a race to produce more and more, resulting in wastage and destruction at greater scales.
  • Similar demands would certainly be made for more and more number of agri items. May be vegetable and fruit growers would join the dharna and rasta rokos.  Apple growers already are demanding a MSP.
  • Already Telengana paddy surplus has made its Chief Minister sit on a dharna demanding procurement of entire state produce paddy on MSP!!!
  • There is no Income tax incidence on agricultural income in India. A number of subsidies are available to farmers.
  • The Indian government makes a regular payment to farmers for seed and fertilizer procurement in three installment per year.
  • MSP payment are to be made out of tax paying hard working people of India. It is better to have a free economy so that all people share equally in pay outs for agri produce.

Compulsory Minimum Support Price

Government of India has announced that a committee of agriculturists and agri scientists would be constituted to come out with recommendation on MSP laws.  Below are some ideas which could be worth pursuing by this committee.

  1. Decide on what would be the items of agri produce in addition to those already covered.
  2. Decide on quantum of each produce which is required for our consumption.
  3. Decide whether a produce could be competitively exported and if so how much quantity is to be targeted for same.
  4. Each state to decide what agri produce is suitable for the soil and weather prevalent in that state. 
  5. Distribute the agri product in best way possible amongst the states. Eliminate as far as possible variation in the agri produce yields due to soil and weather variations.
  6. Transport of agri produce between states should both cost effective and time effective.
  7. While deciding on the MSP of the produce, subsidies on cost of fertilizers, electricity and diesel to farmers may either be thought as withdrawn OR added in the structure of MSP. Agri prices should adhere to normal market behaviors. If input costs increase, MSP increases and if input costs decrease, MSP decreases.
  8. MSP for the agri produce having international trade potential needs encouragement.
  9. Central to MSP debate is that State must encourage diversification in agri produce portfolio in their areas. AND farmers need to respond favorably in this direction.
  10. Inter-crop price parity can be utilized to encourage or discourage a particular Cropping pattern.
  11. Farmers would need to be ready to give land for establishing industrial clusters for transformation of their excess produce to commercial use e.g. bread, biscuits, floor, frozen, ready to eat as well as for modern very large godowns.
  12. Agriculture is a state subject and be primarily resolved at state level. State governments should have their own Agricultural Prices Commissions.

Fixing of MSP through such a process would be a task which would take collation of many data from various sources and thereafter its interpretation. The demand for immediate declaration of MSP law, as a sine qua non for lifting of the crippling and damaging blockage of several main high ways, should not be insisted on by the farmers associations.  They need to repose trust in the Indian and their state governments and give them time.  Farmers of all States also need to deliberate freely in the formulation of such MSPs.

MSP would be successful only if Farmers produce is in sync with demand for its consumption.

Point to Ponder: will our farm produce become non-competitive for world export with general MSP domain.

Readers what are your views ?

Posted in farm guide, NEWS Tagged with: ,

AGRICULTURE POLLUTION AND CLIMATE CHANGE

Modern Industrial like Agriculture activities are creating agriculture pollution, thereby degrading our environment and affecting climate change. Are you shocked, sadly that is a reality?

We have been initiated to think environment degradation, and consequent climate changes, are due to air pollution from factories, vehicular traffic, thermal electric generating plants, air conditioners and refrigerators, deforestation etc. Yet the fact remains industrial agriculture activities of our farmers also pollute and contribute to such changes. 

Methane emissions, fertilizer runoff, forests converted to agriculture, reduced tree cover – the agriculture pollution contributes to climate change, knowingly or unknowingly.

The need of hour is

  • Recognizing how agriculture pollution happens.
  • Farming community to take appropriate effective steps to stop altogether or slow down such pollution.

Recognizing Agriculture Pollution

Livestock pollution:

Animals for consumption as meat and poultry are kept in secure concentrated areas.  They poop in those close spaces. This poop waste is disposed of by storing it in heaps over land parcels and using it as fertilizer.

This fertilizer tends to be used in vastly greater quantity than required by earth. This excess, which is beyond the earth’s absorption capacity, runs off into water sources and ground water. Phosphorous and Nitrogen of this poop fertilizer creates havoc with living beings in the water bodies and rivers.

Another way animal pollution is happening is that animal and their poop manure pollute our air. We are familiar how dung heap smell. Ammonia is released and that combines with other air pollutants like nitrogen oxide and sulfur.  Breathing this air causes lung and heart problems.

Food crop pollution:

In the earlier days, farmers would take one food crop and then plant cover crops or move to another land. Now that synthetic fertilizers are available, that necessity is removed. Farmers tend to over use nitrogen fertilizer in their zeal for greater production and cost effectiveness. Over fertilization is not absorbed by earth. This sets in motion both water borne and air borne pollution. Nitrogen in air gets converted to nitrous oxide, a greenhouse gas or nitrogen oxide which contributes to ground level smog.

Many examples abound of how excess nitrogen run off into ground water and water bodies has caused severe damage to marine ecologies, and significantly to human population who use such polluted water. Again heavy fertilization turns soils acidic and barren. The micro-nutrients so necessary for crops is vastly diminished.

Production of crop is not linear with increasing nutrient usage – explained in this graph.

Fertilizer optimum dose after which agriculture pollution occurs
fertilizer vs yield

Chemical Pesticides Pollution:

Farmers use, in fact have to use, chemical pesticides of all types to deal with sucking, cutting creatures, insects, fungi, rats etc.  Kept to prescribed safe levels pesticide usage harms only the intended.  To achieve results in quickest possible time higher and dangerous levels of such chemical are used unknowingly by some farmers on certain types of crops.  This over use exposes farm workers to many types of diseases and infirmities.

Pollinators are also hit by such sprays of pesticides.  Absence of pollinators eventually leads to less production of pollinated crops.

Increased acreage agriculture pollution:

The continuously increasing humankind also requires more land to live, farm and work. Farmers tend to increase their holdings to cope with increasing demand for food. Land is being taken away from forests almost continuously. Deforestation is taking place. This leads to reduction in the carbon storage capacity of the forests and to increase in carbon pollution in the air. The carbon balance is tilting towards negative.

How We Can Reduce Agriculture Pollution

Agriculture has always been the interface between natural resources and human activity. It holds the key to solving the two greatest challenges facing humanity: eradicating poverty, and maintaining the stable climatic corridor in which civilization can thrive. It is estimated that by 2050, we would be 10 billion. Feeding 10 billion, and yet maintaining climate balance, is a big challenge.

Steps are needed urgently, now, to reduce agriculture pollution. These steps require active participation of ordinary people, the farmers, the governments, the support groups etc.

  1. Eat more plant-based foods.
  2. Ensure there is no wastage of food.
  3. Support and use organic.
  4. Buy in bulk to limit your packaging consumption.
  5. Grow your own food in any small plot or on roofs or pots, can etc. without chemicals. You’ll have a better understanding of regenerative farming and will be able to reward yourself with organic, in-season produce.
  6. Be more vocal in your support of pro-environment practices.
  7. Give farmers incentives to use the best practices for reducing nutrient pollution and chemical pesticide pollution.
  8. Small farmers should adapt to climate change and make their livelihoods resilient by diverting to other rural economic activities. Take up green manuring, nitrogen-fixing cover crops and sustainable soil management. Integration with agro forestry, dairy and animal production needs to be taken up.
  9. Livelihood diversification in rural households helps in climate risks by combining on-farm activities with seasonal work.
  10. Farmers need to plant trees around fields or concentrated in one place to compensate for deforestation.

Another type of agriculture pollution is caused by burning of crop residue in several parts of the world. This pollution and ways to deal with will be attempted in a separate blog.

Read also

Modern Technology Boosts Agriculture Farming and SIX STEPS TO MAKE AGRICULTURE AN ECONOMIC ACTIVITY

Any suggestions or advice – welcome through this blog.

Reference:

  1. www.nrdc.org 2. www.epa.gov

Posted in Climate Change, farm guide, NEWS Tagged with: , ,

PAY ATTENTION TO CLIMATE CHANGE

The Inter Government Panel on Climate Change (IPCC) has brought out its Report recently.

The report has studied current and future impact on Climate Change by human interactions such as generation of the greenhouse gases (GHG), air pollutants, aerosols, rapid urbanization of farm lands, solar and volcanic activities.

Present scenario

climate changes in global surface temperature 1850-2020

Report comes out with high confidence that human-induced climate change is the main driver of frequent Hot extremes (including heat waves) across most land regions since the 1950s, while cold extremes (including cold waves) have become less frequent and less severe. Heavy precipitation events have increased since the 1950s.

Agricultural and ecological droughts have increased in some regions due to increased land evapotranspiration. It is likely that the global proportion of major (Category 3–5) tropical cyclone occurrence has increased over the last four decades.

Climate change is already affecting every inhabited region across the globe with human influence contributing too many observed changes in weather and climate extremes.  World has witnessed wild forest fires, hurricanes and cyclones, extreme precipitation, extreme changes in temperature, melting of glaciers etc. This is when average temperature rise has been around 1.1 degrees C.

Possible Climate Futures

A set of five new illustrative emissions scenarios is considered in this report to explore the climate response to a range of greenhouse gas (GHG), land use and air pollutant futures. These projections also account for solar activity and background forcing from volcanoes.

Results over the 21st Century are provided for the near-term (2021–2040), mid-term (2041–2060) and long-term (2081–2100) relative to 1850–1900, unless otherwise stated.

If humankind manages it’s environs very well temperature increases will be very less than current levels for that period. Otherwise high dangerous levels of increase are forecast. (see notes below for explanation of SSP scenarios.

climate changes in global surface temperature in 2081-2100

Under scenario SSP5-8.5 with very high GHG emissions the 1.5°C global warming level is very likely to be exceeded  to even 4 degrees C.

Under scenario SSP1-1.9 with low and controlled GHG, the 1.5°C global warming level it is more likely than not that global surface temperature would decline back to below 1.5°C toward the end of the 21st century, with a temporary overshoot of no more than 0.1°C above 1.5°C global warming.

Every additional 0.5°C of global warming causes clearly discernible increases in the intensity and frequency of hot extremes, including heat waves (very likely), and heavy precipitation (high confidence), as well as agricultural and ecological droughts in some regions (high confidence).

Additional warming is projected to further amplify permafrost thawing, and loss of seasonal snow cover, of land ice and of Arctic sea ice (high confidence). The Arctic is likely to be practically sea ice free in September at least once before 2050 under the five illustrative scenarios with more frequent occurrences for higher warming levels. There is low confidence in the projected decrease of Antarctic sea ice.

The following figures show what difference every increment of global warming makes in regional mean temperature, precipitation and soil moisture.

annual mean temperature change in degree C at different levels of warming
annual mean precipitation change % relative to 1850-1900 at different warming levels.
annual mean total column soil moisture change std deviation at different warming levels

Under scenarios with increasing CO2 emissions, the ocean and land carbon sinks are projected to be less effective at slowing the accumulation of CO2 in the atmosphere.

See figure below.

GtCO2 emission absorption by land, sea and atmosphere under different warming scenarios will affect climate change

Many changes due to past and future greenhouse gas emissions are irreversible for

Centuries to millennia, especially changes in the ocean, ice sheets and global sea level. Whatever we have allowed to happen has caused such damage that it will take centuries to undo the same.

Selected indicators of global climate change under the five illustrative scenarios

global surface temperature change relative to 1850-1900 - driver of climate change
September arctice sea ice under 5 scenarios - driver of climate change
global mean sea level change relative to 1900 - driver of climate change

With further global warming, every region is projected to increasingly experience concurrent and multiple changes in climatic impact-drivers. Changes in several climatic impact-drivers would be more widespread at 2°C compared to 1.5°C global warming and even more widespread and/or pronounced for higher warming levels.

Cities intensify human-induced warming locally, and further urbanization together with more frequent hot extremes will increase the severity of heat waves (very high confidence). Urbanization also increases mean and heavy precipitation over and/or downwind of cities (medium confidence) and resulting runoff intensity (high confidence).

In coastal cities, the combination of more frequent extreme sea level events (due to sea level rise and storm surge) and extreme rainfall/river flow events will make flooding more probable (high confidence).

Limiting Future Climate Change

From a physical science perspective, limiting human-induced global warming to a specific level requires:

  1.  Limiting cumulative CO2 emissions, reaching at least net zero CO2. We need to adopt limit tree cutting and also expand our forest cover. Other more advanced methods like carbon storage in suitable rocks in carbonate form and increasing farm soil extent are also solutions besides several others.
  2. Strong reductions in other greenhouse gas emissions.
  3. Strong, rapid and sustained reductions in CH4 emissions.
  4. We need to re-plan and re-design our urbanization methodology to provide for more tree cover and open spaces.

Every tonne of CO₂ emissions adds to global warming.  Changes are irreversible for many centuries.

Scenarios with very low or low GHG emissions (SSP1-1.9 and SSP1-2.6) lead within years to discernible effects on greenhouse gas and aerosol concentrations, and air quality.

It is not only the governments alone but the entire mankind wherever they may be on this mother earth to urgently and immediately take up steps to mend and correct our human interactions. Save our Climate and not let it Change for worse.

Further Reads: 1. https://myknowledgebase.in/climate-change-agriculture-practices-india-farming/

2. https://www.ipcc.ch/report/ar6/wg1/

Acknowledgement: This blog is based on, and contains some text and figures, from IPCC AR6

EXPLANATION OF TERMS

  • Human-caused radiative forcing of 2.72 [1.96 to 3.48] W m–2 in 2019 relative to 1750 has warmed the climate system. This warming is mainly due to increased GHG concentrations, partly reduced by cooling due to increased aerosol concentrations.
  • The five illustrative scenarios are referred to as SSPx-y, where ‘SSPx’ refers to the Shared Socioeconomic Pathway or ‘SSP’ describing the socioeconomic trends underlying the scenario, and ‘y’ refers to the approximate level of radiative forcing (in W m–2) resulting from the scenario in the year 2100
  • Each finding is grounded in an evaluation of underlying evidence and agreement. A level of confidence is expressed using five Qualifiers: very low, low, medium, high and very high, and typeset in italics, for example, medium confidence.
Posted in Climate Change, NEWS Tagged with:

India Going for Big Boost in Palm Oil Production

There has been a decline in domestic demand for palm oils over the past couple of years due to high global prices and the lock downs. But a big rise in global prices will likely push the import bill to Rs 1.26 lakh crore in the current oil year (November-Oct), against Rs 75,000 crore last year,” said BV Mehta, executive director of Mumbai-based Solvent Extractors’ Association of India (SEA)

palm tree

Prime Minister of India announced a National Mission on Edible Oils and Oil Palm (NMEO-OP) with an investment of over Rs.11000 crore for building the ecosystem to boost the production, in a bid to reduce India’s dependency on edible oil mostly palm oils imports,

India’s vegetable oil economy is world’s fourth largest after USA, China & Brazil.

Palm oil has 55 percent share in total edible oil imports of India. The NMEO-OP would ensure that farmers get all facilities from quality seeds to technology to promotion of cultivation of palm and other oil seeds.

While India is self-sufficient or Aatmanirbhar in rice, wheat and sugar but the country is dependent on huge imports of edible oils.

With this policy, farmers would be able to replicate what has been achieved in production of pulses recently and in the past in production of wheat and paddy. Farmers need to make same efforts to boost the domestic production of edible oils. Aggressive effort is need of the hour to become self-reliant in edible oil.   

India grows 9 annual oil seed crops, which include 7 edible oil seeds (groundnut, rapeseed & mustard, soybean, sunflower, sesame, safflower and niger) and two non-edible oil seeds (castor and linseed). Oil seed cultivation is undertaken across the country in about 27 million hectares mainly on marginal lands, of which 72% is confined to rain fed farming.

More that Rs. 11000 crore will be invested in the cooking oil ecosystem under this missions. The money India spent on oil imports should rather go to the farmers.

Palm oil farming can be expanded and promoted in the northeast and Andaman and Nicobar region where the cultivation can be taken up easily.

Benefits would go to consumers who would get quality cooking oils at a cheaper rate, savings of foreign exchange in imports, benefit processors and entire value chain, thereby creating job opportunities.

A substantial portion of our requirement of edible oil is met through import of palm oil from Indonesia and Malaysia.  

While the import of palm oil was of same order (around 13 million tonnes), there was a steep increase of 65% in import cost due to rise in prices from FY 20 to FY21.

It may be noted that prices of edible oil have been on the rise for last few months. Average rise in retail have been up to 52 percent in July this year compared to the year ago period.

Announcement of this scheme is a giant step for oil palm development in the country and towards more self reliance.

The details of the policy will be awaited.

Posted in Edible Oils, NEWS Tagged with: